The era of vague AI promises is over. In 2026, the scramble is for hard data—and a new generation of economic dashboards is providing it, revealing a complex story of surging productivity, uneven job displacement, and a future being written in real-time code.
We've all heard the grand promises. Artificial intelligence will usher in an unprecedented era of AI productivity, reshape global GDP, and redefine the nature of work itself. But for years, leaders have operated on faith and fragmented case studies. Are AI tools genuinely boosting output, or are they just creating a new form of digital busywork? Is the economic impact a slow burn or a seismic event?
As we move through 2026, the hype is maturing into a demand for rigorous evidence. Stanford’s 2025 AI Index highlighted a critical gap: while investment and model capabilities are tracked meticulously, real-time, macro-level measurement of AI’s effect on jobs and growth has been lagging. The answer is emerging not from a single report, but from a dynamic new tool: the AI dashboard. These sophisticated platforms are replacing speculation with streaming data, offering a live pulse on the AI-transformed economy.
The Measurement Gap: Why We’ve Been Flying Blind
For most of the past decade, understanding AI’s economic impact has been an exercise in delayed hindsight. Traditional economic indicators—quarterly productivity reports, annual employment surveys—move far too slowly for a technology evolving weekly. Economists and executives were forced to rely on surveys (which are subjective and lagging) or extrapolate from micro-studies of individual firms.
This created a fog of war. Headlines would swing wildly between predictions of mass unemployment due to automation and sunny forecasts of AI creating more jobs than it displaces. Businesses struggled to calculate ROI on massive AI investments, often left wondering if their tools were driving real efficiency or just shifting workloads.
The core problem is that AI’s effect is not monolithic. It automates specific tasks, not entire jobs, at an unpredictable pace. As highlighted in a recent TrendFlash analysis on the future of work, AI is redefining careers and skills in real-time, creating a mismatch between traditional job titles and the actual work being done. This granular, task-level revolution is invisible to blunt macroeconomic instruments. We needed a microscope tuned to the digital economy, and that’s exactly what AI dashboards provide.
The Dashboard Revolution: A Live Feed to the AI Economy
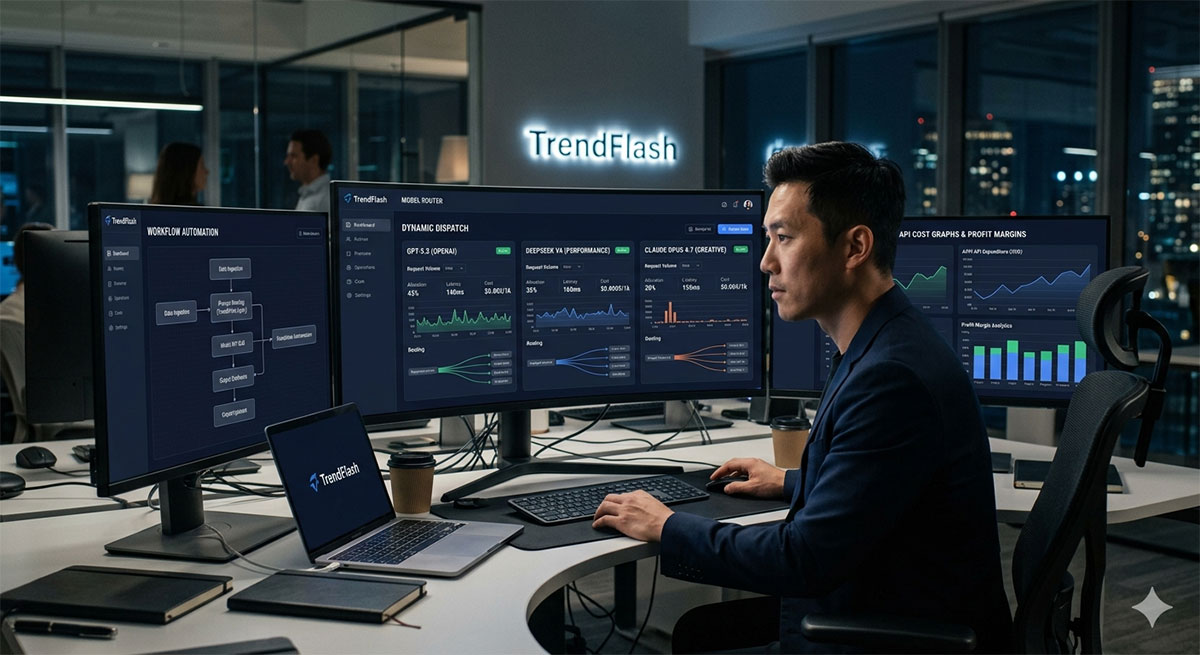
Imagine a Bloomberg Terminal, but for the AI revolution. The next-generation AI dashboard aggregates and analyzes high-frequency data from dozens of sources to provide a coherent, real-time picture. These aren't simple reporting tools; they are complex analytical platforms powered by the very AI they seek to measure.
What These Dashboards Track: The Key Metrics
Modern AI economic dashboards focus on a multi-layered set of indicators that go far beyond simple adoption rates.
| Dashboard Layer | Key Metrics Tracked | Why It Matters |
|---|---|---|
| Labor & Employment | Task automation rates, skill demand heatmaps, job postings analytics, freelance project volatility. | Moves beyond net job numbers to show the churn—which tasks are disappearing and which new skills are commanding premiums. |
| Enterprise Productivity | AI tool usage intensity, output-per-hour data from connected systems, project cycle times, cross-industry efficiency benchmarks. | Measures if AI tools are actually accelerating work or just adding another layer of software. |
| Investment & Activity | Real-time API call volumes to major models (OpenAI, Anthropic, etc.), cloud AI service spending, venture flows into AI startups. | Provides a leading indicator of economic activity and adoption intensity before it shows up in corporate earnings. |
| Sectoral Transformation | Industry-specific automation indices (e.g., code completion in tech, document review in law), supply chain AI integration scores. | Reveals which sectors are transforming fastest, allowing for targeted policy and investment. |
The power lies in correlation. For the first time, a policymaker can see if a spike in task automation in administrative roles correlates with a rise in demand for “AI training coordinator” positions. A CEO can benchmark her company’s AI-driven productivity lift against a live industry standard. This turns abstract trends into actionable intelligence.
From Data to Insight: What the Dashboards Are Revealing in 2026
Early data from pioneering dashboards in 2026 is painting a nuanced picture that defies simplistic narratives. The economic impact is profound, but deeply uneven.
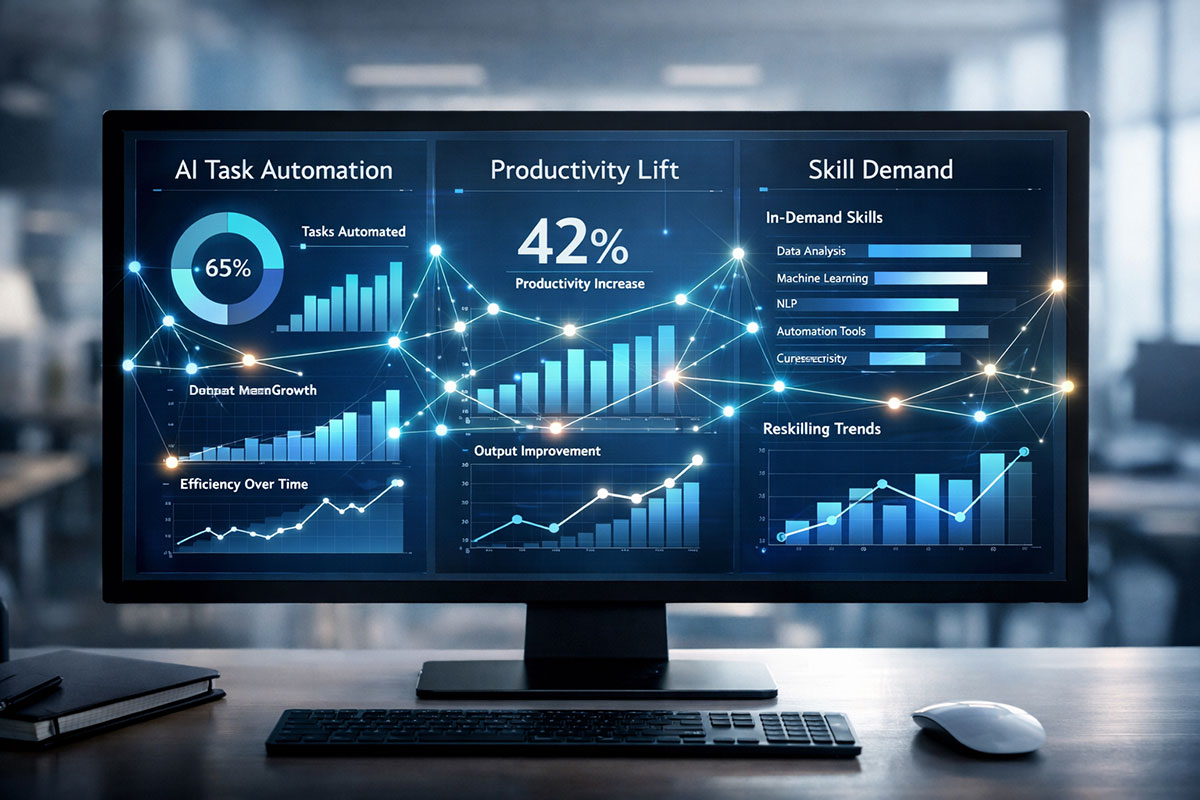
1. The Productivity Surprise is Real, But Concentrated
Initial data confirms a significant AI productivity boost, but it’s not uniform. The gains are highly concentrated in roles and industries where AI can take over low-to-mid-complexity task automation within a clear digital workflow. For example, dashboards show software development cycles accelerating by 15-35% where AI coding agents are deeply integrated, while creative brief writing time has plummeted. However, roles requiring high-stakes judgment, physical dexterity, or complex interpersonal negotiation show minimal direct productivity lift from current AI tools.
2. Labor Displacement is a Wave, Not a Cliff
The feared mass unemployment event appears, in the dashboard data, as a rolling wave of labor displacement. Jobs aren’t vanishing overnight; instead, bundles of tasks are being eroded. Dashboards tracking job description keywords show a steep decline in demand for skills like “data entry,” “basic content generation,” and “initial customer triage.” Simultaneously, as explored in our analysis of the AI job market, there is explosive growth in demand for “AI workflow orchestrator,” “prompt engineer,” and “human-AI interaction designer.” The labor market isn’t collapsing; it’s undergoing a stressful and rapid metamorphosis.
“The dashboards show we’re not in a simple substitution economy,” notes Dr. Anya Chen, an economist at the Stanford Digital Economy Lab. “We’re in a recomposition economy. AI handles discrete tasks, freeing human time. The economic value—and the new jobs—come from figuring out what to do with that newly freed human attention and creativity.”
3. The Great Implementation Divide
Perhaps the starkest insight is the gap between leaders and laggards. Dashboards reveal that companies with a strategic, integrated AI adoption plan are pulling away from competitors who are just dabbling. The metric isn’t just “Do you use ChatGPT?” but “What percentage of core workflows have been intentionally redesigned around AI capabilities?” This divide in execution is becoming a key predictor of future market share and profitability, a trend moving from pilot projects to core profit drivers, as discussed in shifts towards AI execution.
Building Your Own Lens: A Framework for an Organizational AI Dashboard
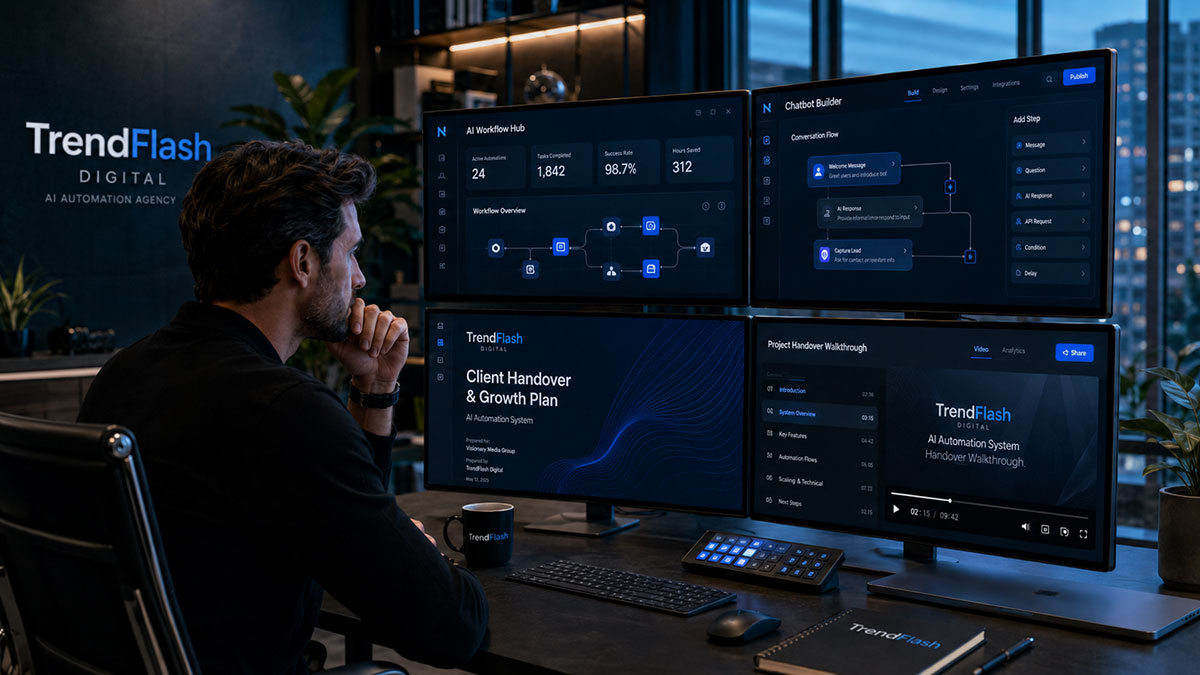
For business leaders, the question becomes: how do we build this intelligence internally? A functional organizational AI dashboard doesn’t require a billion-dollar budget; it requires a strategic focus on the right data points.
Phase 1: Instrument Your Workflows
The foundation is data. You must instrument your key systems to measure activity and output. This means:
- Tracking AI Tool Usage: How many employees are using approved AI tools? At what frequency? For what types of tasks?
- Measuring Task Completion Time: Establish baselines for key processes (e.g., report generation, code review, marketing asset creation) and track changes over time as AI is introduced.
- Mapping Skill Utilization: Use internal project and HR data to understand how employee time is being reallocated from automated tasks to new activities.
Phase 2: Focus on Leading Indicators
Avoid vanity metrics. Don’t just track logins; track outcomes.
- Cycle Time Reduction: Time from project initiation to completion.
- Output Quality: Error rates, customer satisfaction scores tied to AI-augmented outputs.
- Employee Capacity: Are teams handling larger volumes or more complex work with the same headcount?
- Innovation Metrics: Number of new products/prototypes developed, enabled by AI-augmented R&D.
Phase 3: Integrate External Intelligence
Your internal view is incomplete without context. Subscribe to or access aggregate data from industry-specific and macro AI dashboards. How does your firm’s automation rate compare to your sector’s average? Are you ahead or behind on adopting the latest agentic workflows that are reshaping industries? This external benchmarking is crucial for strategic pacing.
The Future of Measurement: Predictive and Prescriptive Dashboards
The current wave of dashboards is largely descriptive—they tell us what is happening now. The next evolution, already on the horizon for 2027-2028, is toward predictive and prescriptive analytics.
Future platforms will not only show which tasks are being automated today but will use AI metrics and simulation to forecast which roles will transform next in your specific industry. They will move from being a report to being a strategic advisor, suggesting where to reskill employees, which new AI capabilities to pilot, and how to structure teams for a “human-plus-AI” future. This aligns with the emerging reality where the biggest bottleneck is shifting from model intelligence to seamless AI agent collaboration, as seen in the development of protocols for an agent internet.
Conclusion: From Guesswork to Strategy
The arrival of real-time AI dashboards marks the end of the speculation era in the AI economy. We are no longer forced to guess. The data is clear: AI is driving a significant but uneven productivity revolution, labor markets are recomposing around new skills at high speed, and a vast implementation gap is creating winners and losers.
For executives, the mandate is to build their own measurement capabilities. For policymakers, it’s to utilize this data to smooth the transition for workers. And for individuals, understanding these trends is key to future-proofing a career. The AI economy is here, and for the first time, we can all see its heartbeat.
Continue your exploration of how AI is reshaping our world:
- Delve deeper into how agentic AI is moving from simple chatbots to autonomous virtual coworkers that plan and execute complex tasks.
- Understand the financial forces at play in our breakdown of the economics of AI, tracking where investment flows and where real ROI is being generated.
- Get ahead of the next shift by exploring how businesses are moving from pilot to profit, focusing on scalable AI execution for measurable financial return.
About the Author
Girish Soni is the founder of TrendFlash and an independent AI strategist covering artificial intelligence policy, industry shifts, and real-world adoption trends. He writes in-depth analysis on how AI is transforming work, education, and digital society. His focus is on helping readers move beyond hype and understand the practical, long-term implications of AI technologies.